This page shows the results of some tests of the SERENDIP 5 ADCs using the ATA-4 FBoard PFB code. For all tests, the "Real A" (aka "adc1") and "Real B" (aka "adc3") inputs were used. The raw ADC outputs were captured and a 1024 point FFT was performed using the FFTW library. No signal processing was performed on the SERENDIP 5 card itself.
The sample rate for these tests was 100 MHz. The noise sources used were band limited to 150 to 200 MHz. Due to the undersampling, the 50 MHz band gets folded over such that the 200 MHz end of the band appears at DC (i.e. the left end of the spectrum) and the 150 MHz end of the band appears at 50 MHz (in the center of the spectrum).
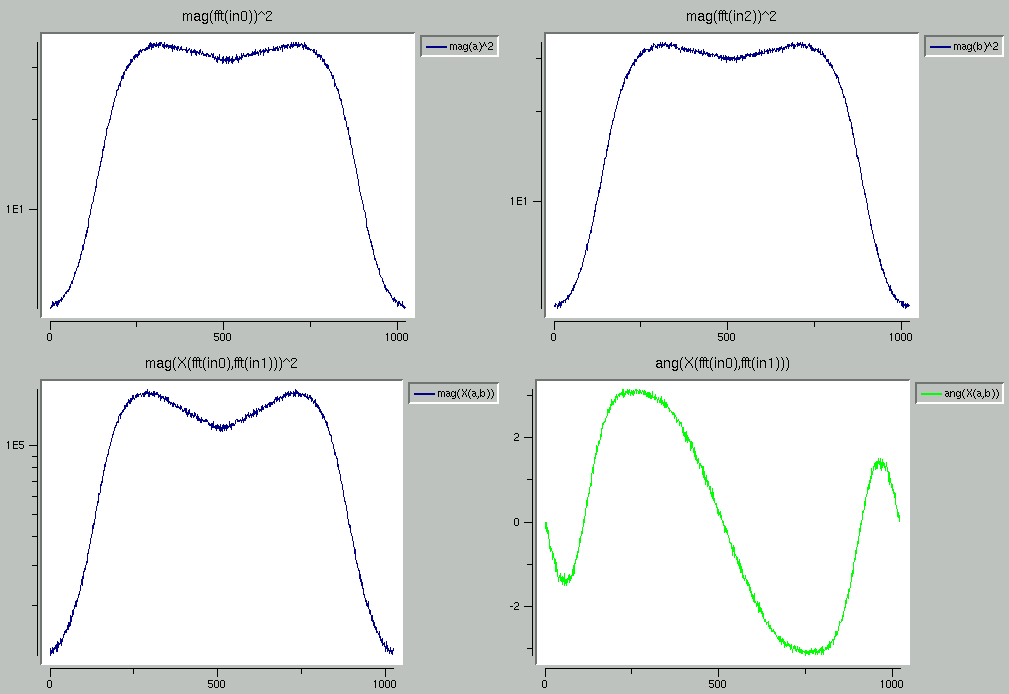
Each image shows four plots. The top two plots are the integrated magnitude of the two input spectra (squared for power). The lower left and right plots are the integrated magnitude (squared for power) and angle, respectively, of the cross correlation of the two input spectra.
This image shows the cross correlation of the spectra of one noise source sampled by two different ADCs on the SERENDIP 5 board.
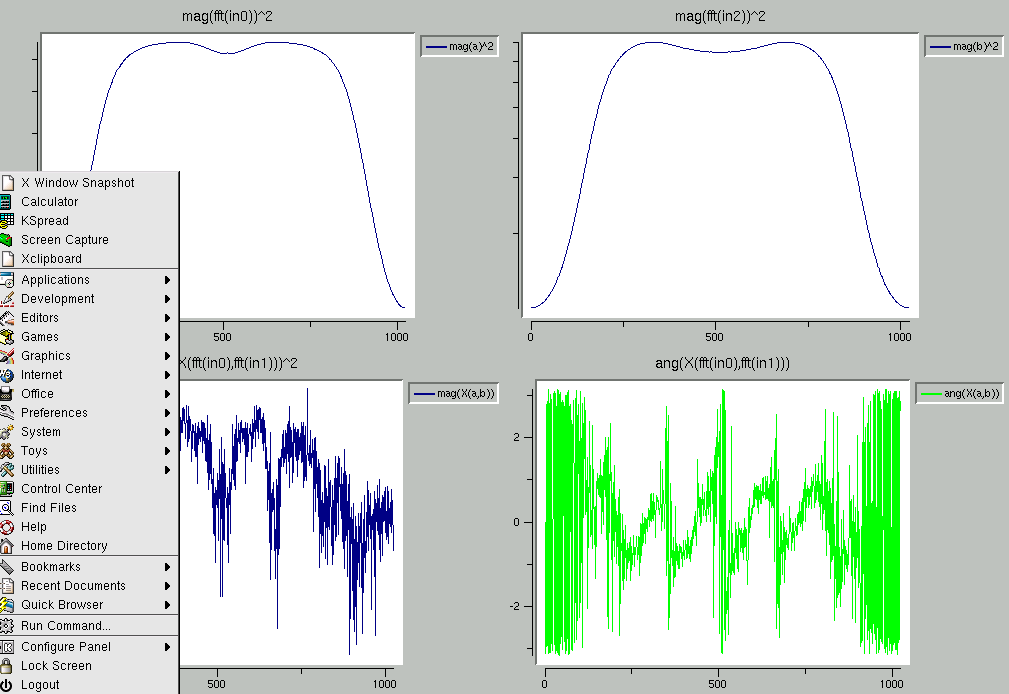
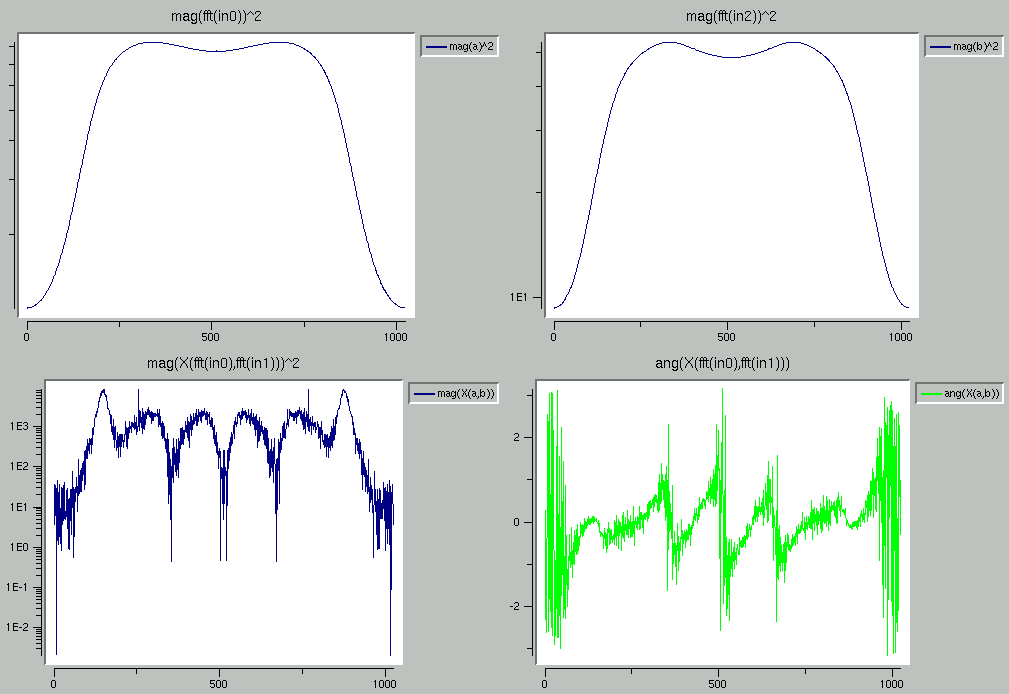
Here are some images showing the results of long integrations of the cross correlation of the spectra of two independent noise sources sampled by the SERENDIP 5 board.
This image is the result of an approximately 30 hour integration. Due to operator error, the lower left corner of the image is obscured by the system menu.
This image is the result of an approximately 100 hour integration.
The roll off on the "low end" (which is really the "high end") of the input spectra starts sooner than expected. The causes of this have not yet been pinpointed, but further testing can determine how much of it is inherent to the SERENDIP 5 board and how much is due to external factors.
The structure in the correlated phase of the "One Noise Source, Two Digitizers" test is believed to be caused by a combination of cable length mismatch and ADC clock skew. The FBoard code will be modified to generate each ADC clock from a Virtex II Digital Clock Manager such that the skew (aka relative phase) of the ADC clocks can be dynamically adjusted to within +/- 20 picoseconds. This will be sufficient to correct for skew introduced by FPGA and PCB routing. It can also be used to correct for any sub-sample skew in the incoming data introduced by cable length mismatch.
The structure in the cross correlation of two noise sources is unexpected. It resembles the results expected if one input is delayed by six samples and then somehow coupled to the other input. As it turns out, the ADCs on the SERENDIP 5 board have a six sample pipeline which suspiciously corresponds to that six samples of delay. It is also possible that fixing the clock skew problem will also fix or minimize any crosstalk that is occurring as the result of switching noise caused by the ADC outputs.