
Molecular Cloud, dust Emission nebula (red)
| DATE | Lecture 18 |
| TITLE | Discovery of the Milky Way |
| READING | Chapter 15 |
| MAIN CONCEPTS | The Interstellar Medium, Size and Shape of our Galaxy |
The space between the stars is not quite empty. It contains hydrogen
gas (and 10% helium) along with about 1% the mass of the gas in "dust"
(sub-micron sized particles of Si, C, Mg compounds and ices, produced in
red giant winds and planetary nebula expulsions and nova and supernova
explosions). The dust can be opaque to visible light if enough of it is
found along the line-of-sight. Most of the ISM is filled with hot, very
diffuse gas (106K, 10-3 particles/cc). This comes
primarily from the insides of supernova remnants. Floating in this hot
medium are cooler clouds of gas and dust. The densest of these are the
"molecular clouds", so-called because the hydrogen is in molecular
form (H2) and they have other molecules (notably CO). The molecules
can exist because the densities are high (104 -106
/cc) and the temperature is low (20K). There can be thousands of solar
masses of material in the cloud, with an extent of 10s of ly, and enough
dust to shield the interior from the UV light between the stars. Around
the molecular cloud maybe a cloud of neutral hydrogen, with temperature
of few thousand K and densities of 1/cc. Such clouds also exist by themselves
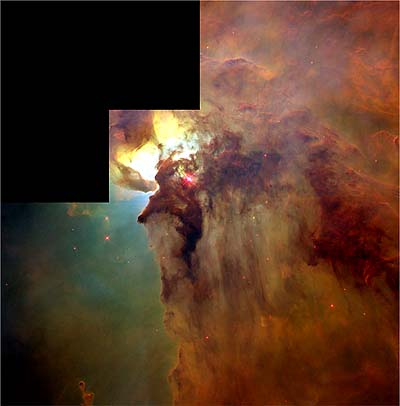
(without molecular cores). The molecular clouds are the site of new star
formation. When a massive star forms inside, it will ionize the surrounding
hydrogen, making an "HII region". These are the glowing "emission
nebulae" which make beautiful pictures. The optical light from the recombining
hydrogen glows red in the "H-alpha line". Starlight reflecting off
dust will look blue (like sunlight reflecting of air molecules in
our day sky). Looking at the star through the dust of the cloud will redden
and dim it (redden because the blue light is scattered away). It is
this effect which obscures most of our Galaxy from view.
Here
is a more detailed description...
Molecular Cloud, dust
Emission nebula (red)
Here is the Hubble Space Telescope Nebula Gallery...
Discovery of the Galaxy
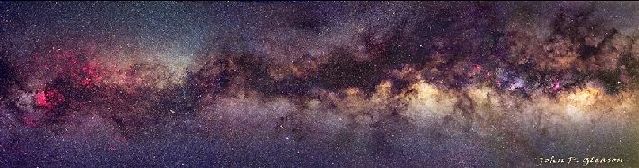
The recognition that our Galaxy must be a flattened system of stars
came from Kant and Wright in the 18th century. They noted that the presence
of a
band of stars - the Milky
Way- implied that most stars are in that plane. Later Herschel,
then Kapteyn, tried to map this system by counting the number of stars
seen in telescopes in various directions (and at various brightnesses).
These translated into a Galaxy with the Sun near the center and a diameter
of perhaps 50000 ly. We now know that Kapteyn's work was seriously affected
by dust absorption in the interstellar medium, which restricts our
view in the Milky Way. Shapley used globular clusters instead, which
lie mostly out of the plane of the Milky Way and so can be seen further.
He calibrated their distances using variable stars (discussed below) and
concluded that the Sun is not in the center of the Galaxy, and that the
diameter of the Galaxy is more like 300,000 ly. He also felt that the other
spiral nebulae which were seen in the sky were part of the Galaxy, while
the other camp thought they are external galaxies. It was later found that
the distance indicators had problems: the Cepheids Shapley was using were
really RR Lyrae stars (and dust must be accounted for); a nova seen in
M31 (the nearest spiral nebula; the Andromeda galaxy) was really a supernova.
These issues were debated at the Natl. Academy of Sciences in 1921 by Shapley
(Mt. Wilson Obs.) and Curtis (Lick Obs.). The problem was resolved when
Hubble observed Cepheids in M31 a few years later. Thus the modern picture
of our Galaxy (with a diameter of 100,000 ly) separated from other galaxies
by millions of ly or more was born. Indeed, a modern picture at the right
wavelength shows that our
Galaxy bears a striking resemblance to other edge-on
spirals.
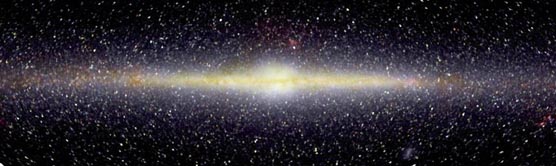
This is an infrared picture of the whole sky, taken with the
COBE satellite.
 Here is an image
of a different edge-on spiral galaxy. Looks familiar!
Here is an image
of a different edge-on spiral galaxy. Looks familiar!
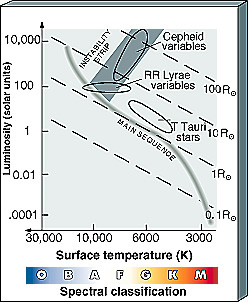
Variable Stars as Standard Candles
Distance is one of the most difficult measurements in Astronomy. It is relatively simple, however, if you know the intrinsic luminosity of an object. Then you need only apply the inverse square law (perhaps worrying about dust) to find the distance from a measurement of its apparent brightness. One nice "standard candle" (source of known luminosity) is the Cepheid variables, and their analogs among metal poor stars, the RR Lyrae variables. These stars are found in the "instability strip" of the HR diagram, where the relation between opacity and temperature in their inner atmospheres makes them pulsate in and out, growing brighter and dimmer. Because a more luminous stars is also bigger and less dense, it takes longer to pulsate. A relation was found between the pulsation period of the Cepheid and its intrinsic luminosity. When calibrated by finding Cepheids in clusters of known distances, this relation can be used to find the luminosity of any Cepheid with a measured period. Cepheids stand out because they vary, and they are also relatively luminous, so they can be seen to great distances. The RR Lyrae stars have a similar period-luminosity relation, but are a little fainter at a given period. One of the key projects for the Hubble Space Telescope was to observe Cepheids in more distant galaxies.