 Under construction.
Under construction.
Within a few years the 3D distribution of galaxies in our local universe will be mapped, and that structure can be matched to the early-time snapshot provided by the CMBR. Since any model of structure formation must explain both the tiny ripples in the Cosmic Microwave Background temperature across the sky, and the large-scale structures we see in the universe today, the combination of these two probes is especially powerful. Together they enable us to probe the spectrum of fluctuations over about 4 decades in length scale and its evolution over almost the entire age of the universe. This information, plus information from smaller, high-redshift/very early time, surveys of galaxies and neutral gas will enable us to piece together the mechanism for the formation and mode of evolution of all of the structure we see around us in the universe. (Follow this link for probes of dark energy.)
Perhaps the most obvious means for surveying the
large-scale structure in the universe is
to measure the position of the nearest galaxies (either in 3D -- redshift
surveys -- or in the 2D projected on the sky -- angular surveys).
Galaxy surveys with well defined selection criteria enable us to extract
information about the clustering pattern. (Surveys during the early
1980s showed that galaxies are not distributed randomly throughout the
Universe. They are found to lie in clusters, filaments, bubbles and sheet
like structures.)
In the early 1980s there were less than 5,000 galaxy redshifts known.
We now have over 1,000,000.
Recent very large scale galaxy surveys have now reached far enough out into
our local volume to begin to see the end of greatness. That is they
sample a large enough volume of space that the largest structures in the
survey (about 100Mpc in size) are no longer of the same size of the survey
itself. We are thus beginning to see a "fair" sample of the Universe which
we can compare to our models in quantitative detail.
To characterize the distribution of galaxies a number of statistical tools
have been developed. The most widely used approach to quantifying the degree
of clustering observed is to measure the correlation functions. For example
the two-point correlation function is the probability, in excess of random,
of finding a galaxy at a fixed distance from a random neighbor.
Its Fourier transform is the power spectrum (which is now more widely used).
Beyond this one investigates higher order correlation functions, for example
the distribution of counts-in-cells: the distribution of the number of
galaxies found in cells of a given size which one lays down atop the survey.
As the new era of surveys catalogues the 3D positions of millions of galaxies
the biggest uncertainty will become the mapping from the clustering of
different galaxy types to the clustering of the underlying matter which the
theories most straightforwardly predict.
There is no reason to expect (and observational evidence to the contrary!)
that the galaxies will trace the matter exactly. The fact that the `light'
does not trace the `mass' is usually called called galaxy bias
(one of several technical uses of the term bias in large-scale
structure)
and poses a fundamental problem on which much work remains to be done.
A (partial) list of past and future galaxy surveys can be found here:
In the spectra of distant quasars one sees a huge number of absorption
lines, redward of the quasar's Lyman alpha emission
(Hydrogen, 2-1 transition, 121.6nm).
The absorption lines have varying strengths (or optical depths) and are seen
superposed upon a background continuum emission from the quasar.
These lines are thought to be due to absorption of the quasar continuum by
clouds along the line of sight which contain (sometimes trace amounts of)
neutral hydrogen.
(For further information
follow this link.)
This forest of
Lyman-alpha lines was discovered over 25 years ago.
Originally studied to learn about the intergalacitc medium and interpreted
as small (10kpc) pressure confined clouds of pristine hydrogen gas left over
from the epoch of recombination, they are now interpreted within a broader
cosmological framework and thought to provide important clues about the
formation of large-scale structure, the nature of dark matter and the shape
of the matter power spectrum (which has important implications for inflation).
Clusters of galaxies are the largest gravitationally bound systems in
the universe, with sizes of a few Mpc (a Mpc is about 3 million light-years).
A typical cluster contains hundreds or thousands of galaxies, but most of
the mass is in the form of a hot intracluster gas. This gas is heated to
high temperatures (106-108K or several keV) in the
potential well of the cluster.
Clusters are rare objects: fewer than 1 in 10 galaxies in the universe resides
in clusters, the rest are said to be ``field galaxies''.
The two most obvious means of studying clusters of galaxies are by observing
the light emitted from the constituent galaxies or the X-ray emission from
the hot intracluster gas.
Recently it has proved possible to observe clusters of galaxies in two other
ways which (in combination with the traditional methods) should prove
exceptionally powerful. The first, known as the
Sunyaev-Zel'dovich effect after the people who first proposed it, is
to observe the cluster as a ``hole'' in the microwave sky.
Due to the free electrons in the hot intracluster gas, photons from the
microwave background are ``upscattered'' in
energy.
This leaves a decrement or deficit in the number of photons at low-frequency
or a hole in the microwave sky.
One can also study the mass of clusters by their gravitational
bending of light.
One can study both the strong lensing by the cluster core and the
weak lensing
from the cluster as a whole
(see this paper
which mapped a cluster at z=0.83).
Weak Lensing
Weak gravitational
lensing denotes that regime where the gravitational deflection of
light is so small that one does not see multiple images.
Instead the images of background objects (galaxies) are sheared
and magnified.
The amount of this shear and magnification depend on the integral of the
gravitational potential along the line of sight, times a function which
depends on the redshift of the source and peaks midway between the source
and the observer. By studying the shear of many galaxies, or the distortion
of the cosmic microwave background, one can statistically infer the amount
of matter as a function of position and time to constrain its properties,
spatial distribution and evoltion.
Numerous large surveys devoted to the study of weak gravitational lensing
are underway around the world, of which the recently completed
DES and the upcoming
LSST are of note.
Quasar Clustering
Just as one can study the clustering of galaxies, one can also study the
clustering of other objects. Many such objects have been studied, but
Quasars hold a special appeal because they have been observed to very
high redshifts (early time).
Both the SDSS and the 2dF have measured the positions and redshifts of
hundreds of thousands of quasars, allowing one to probe large-scale structure
out to COBE scales, test the nature of the initial conditions that formed
structure and measure the evolution of clustering and constrain the
dark energy.
See here for
more information on high-z quasars and
follow this link
for an in depth theoretical discussion of how to measure the cosmological
parameters using quasar clustering.
Peculiar Velocity Measurements
Because of their inherent difficulty, surveys of peculiar velocities have
been few and far between and plagued with systematic errors. A new
generation of surveys is being planned which may overcome this limitation.
For more information
follow this link
to an overview by Alex Kim and collaborators.
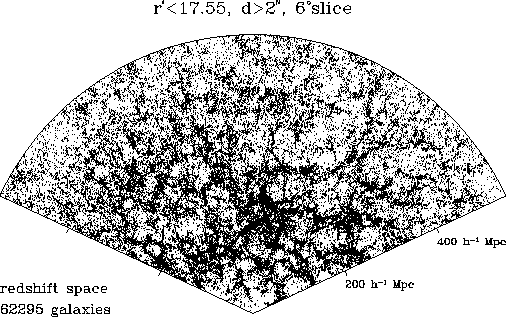
 Current and Future Galaxy Surveys
(Shown is the geometry of the
SDSS:
a cone of pi steradians in the north and
three slices in the south)
A slice through a large simulation of a CDM
universe, showing what the
SDSS expected to see.
The angle across the wedge is position on the sky, the radial distance is
redshift. The actual data look remarkably similar to this prediction.
Future surveys
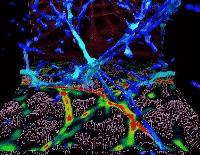 Lyman Alpha Systems
Distribution of the gas density
at redshift 3 from a hydrodynamical
simulation of the Ly-a forest
performed
at NCSA.
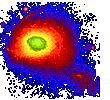 Clusters of Galaxies
A
ROSAT
image of the Coma cluster of
galaxies, one of the two nearest clusters
to the Milky Way. Coma is about 80Mpc
from us, and has a size of about 3Mpc.
